For labs in CS 2, you may choose to either pair program or work alone. For this lab, both partners must do the setup separately to be ready for the rest of the term. The main point of lab is to act as a bridge between lecture and the projects. We aim to give you an “intermediary” programming assignment which will help with the project. For this reason, all labs will be collaborative, and your lab TAs will be extremely helpful. If you get stuck, you should immediately ask for help rather than floundering. Lab is only an hour, and we want you to optimize the time you spend for maximum learning.
To get credit for a lab, you must call over a member of course staff to “check off” that you were present at lab. This is also a chance for us to ask you comprehension questions after you’ve completed the lab. The questions we will ask will usually be embedded in the lab itself.
Setup
If you haven’t already, do the setup. Otherwise, just register for the lab using grinch: https://grinch.caltech.edu/register and clone the repository
as explained in the setup instructions.
After you’ve downloaded the tools, go to the #instructions-for-lab channel on discord and follow the instructions there.
Pair Programming
If you are pair programming with another person, please quickly skim this page.
Goals and Outcomes
In this lab, you will enhance your code reading abilities by debugging an existing class called GradeHistogram, debugging two common Java errors, and finding the
passwords to make a programmatic bomb not explode.
By the end of this lab, you will…
- be able to read test failure messages
- know how to approach debugging code
- have learned about some common Java bugs
- be able to use the IntelliJ debugger to help discover bugs
If you do not finish during lab, don’t panic! You are allowed to continue working on lab outside of the lab period. After you finish, go to office hours to get your lab checked off by Adam or a TA.
Grading in CS 2
In CS 2, labs and projects will be graded on a “letter grade” basis. We’ll explain this more later, but, for now, you should know that passing the tests on gitlab is the only
metric we will use to grade your code. There are no “style points” in this course. This particular lab is so important that the only possible grades are “F”, “D”, “C”, and “A”. We expect
everyone to get an “A”.
Part 1: Debugging GradeHistogram
For this part of the lab, we will approach debugging the code by trying to understand where the tests are failing. To do that, we have to run the tests. Make sure “D Tests” is selected at the top of IntelliJ and click the green play button. The JUnit tests that we have written should run (and all fail!). Your job in this part is to fix the code to make them all pass.
Task 1. While you can read the test code itself, we would recommend reading the test output instead. Click on the name of the first test (“Test add/get”) and read the resulting trace on the right. You should see that the code threw an exception, but where? The blue text will link directly to the line of code that caused the exception. Your first task is to fix this exception by determining what the error is.
After you believe you’ve fixed the error, go ahead and run the tests again. If you’re stuck, feel free to ask someone on course staff for help; it’s what we’re there for. If the tests no longer throw an exception, you’re ready to fix the next bug. Repeat this process until all the tests pass.
After the D tests all pass, move on to the second part of this lab, below.
Part 2: Da Bomb, Warmup
You should begin this part by debugging the Level0 and Level1 classes. You may not need to use any form of debugging other than just reading the code, but
feel free to add println’s to help yourself. These two classes are a warm-up for the third part of the lab, in which you will learn how to use the IntelliJ Debugger.
Task 2.
Fix all the bugs in the Level0 and Level1 classes. After the C tests pass, move on to the next part.
Part 3: Da Real Bomb!
Using the IntelliJ Debugger
Up until now, you may have practiced debugging by placing print statements throughout your code to monitor the values of certain variables. When strategically placed, the output from these print statements may make the bugs obvious or help narrow down their location. This method is called print debugging. Though print debugging is a valid technique, it can be tedious deciding what to print and cleaning up your code after you are done.
Interactive debugging is a technique by which one debugs by using an interactive tool, or a debugger. We will show you the basics of how to use IntelliJ’s built-in debugger.
Setting Breakpoints
Before starting the IntelliJ debugger, you should set a few breakpoints. Breakpoints mark places in your code where you can suspend the program during a debug session and examine its state. This allows you to examine the values of multiple variables without needing to write print statements, and moreover, breakpoints are ignored when the program is executed normally.
To set a breakpoint at a line or a method, click in the gray area next to the line number.
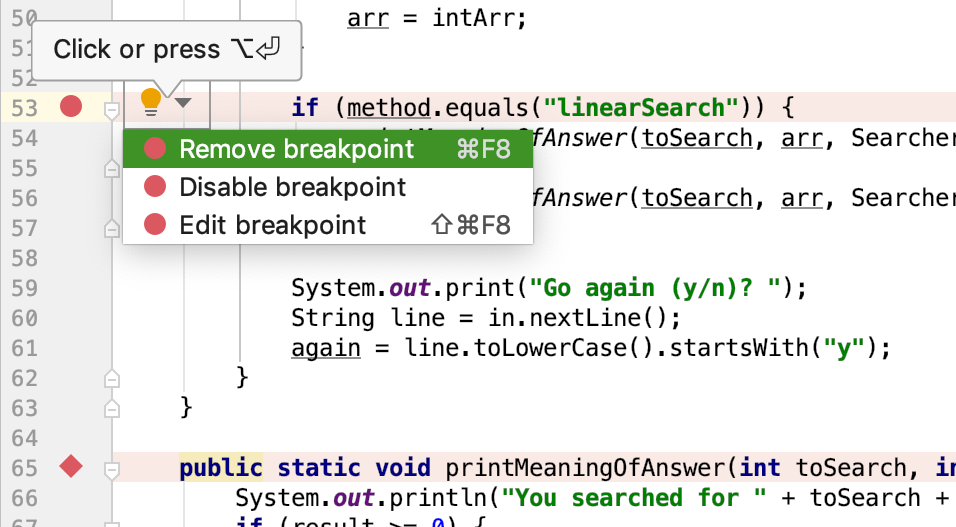
A red circle or diamond should appear where you clicked. When the debugger reaches this point in the program, it will pause before the execution of the line or method. If you click anywhere on a line of code that has a breakpoint, a lightbulb icon will appear on the left and you can click on it to find more options regarding that breakpoint.
Starting the Debug Session
Once you have set some breakpoints, you are ready to start a debugging session! Click on the  icon in the top right of the IntelliJ interface. The selected program should run until it hits its first breakpoint. A debugger window should also appear on the bottom of the interface, where the console was.
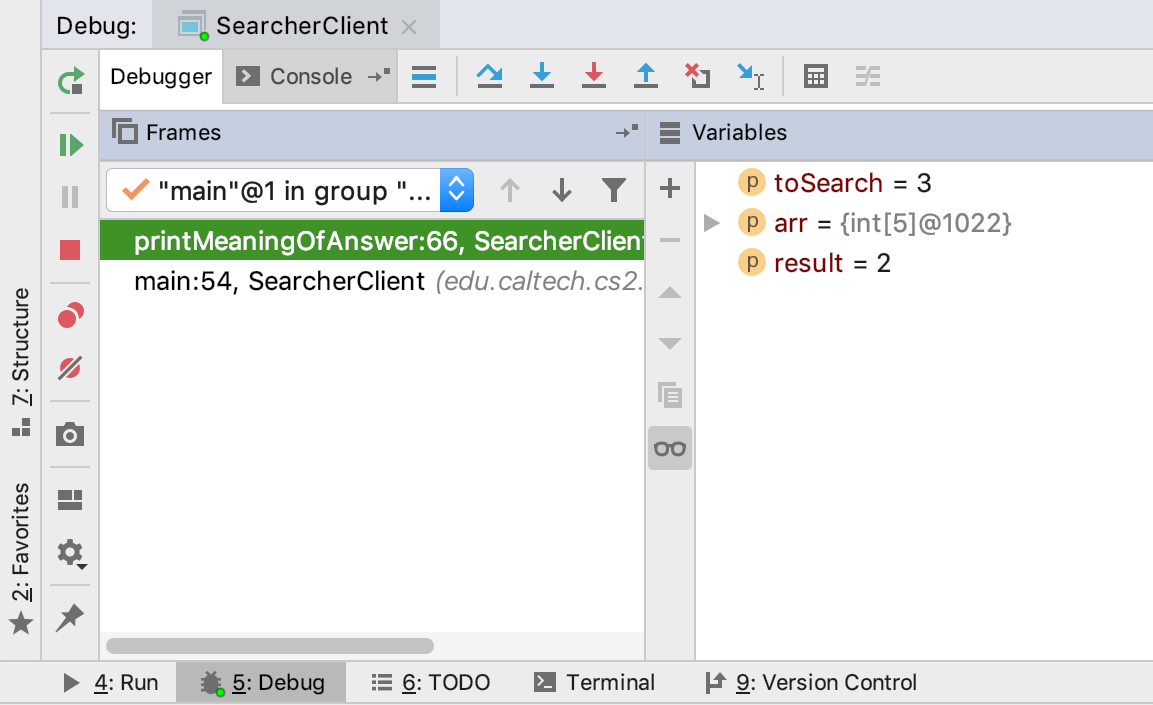
Under “Frames”, you will be able to see all current method calls, and under “Variables”, you will be able to see the values of instantiated variables at this point in the program (they will also be shown in gray text in the editor). From here, you have a few options:
- Learn something from the displayed values and fix your bug! Click
 to stop the debug session.
 - Click
 to resume the program (until it hits another breakpoint or terminates).
 - Click
 to advance the program by one line of code (
 does something similar, but it will step into any method
called at the current line, whereas will skip over it).
does something similar, but it will step into any method
called at the current line, whereas will skip over it).
More Breakpoint Options
Sometimes you may want to have your program pause only on certain conditions. To do so, create a breakpoint at the line of interest and open the “Edit breakpoint” menu (by clicking the lightbulb or right-clicking the breakpoint icon itself). There, you can enter a boolean condition such that the program will only pause at this breakpoint if the condition is true.
Another thing you can do is to set breakpoints for exceptions in Java. If your program is crashing, you can have the debugger pause where the exception is thrown and display the state of your program. To do so, click  in the debugger window and press the plus icon to create a “Java Exception Breakpoint”. In the window that should appear, enter the name of the exception that your program is throwing.
If you are curious to learn more about IntelliJ’s debugger, you can find the help guide at https://www.jetbrains.com/help/idea/debugging-code.html.
Task 3.
The BombMain class calls the phase methods of the Bomb class. Your job is to figure out what the passwords to each of these phases are by using the IntelliJ
debugger. Trying to run through the code by hand is guaranteed to not work, and you are forbidden from adding print statements into the Bomb code.
The point of this exercise is to get comfortable using tools that will help you a lot down the road. Please take it seriously!
Submitting Your Code for Credit
Your code will be autograded when you submit it to gitlab. You may submit to gitlab as many times as you like, and only the last submission will be counted.
Committing and Pushing to the Repository
A “commit” is version control language for a chunk of changes that mean something when grouped together. Importantly, commits will only stay locally on your machine
until you push them to the gitlab server.
Task 4.
To commit to the repository, click the green checkmark on the top-right of IntelliJ’s interface. A window will pop up and
ask you to type in a message. Choose some meaningful description of your feature, then click the little down arrow next to the “Commit” button on the bottom right of the dialog.
Choose “Commit and Push” in the little menu that pops up. If IntelliJ asks you if you’re sure you want to commit and push, say yes.
Checking the Results on gitlab
When you go to https://gitlab.caltech.edu, you should see your lab01 repository listed. Click on it. All the way on the right, there should be a red “X”,
an orange “pause” symbol, a blue “time” symbol, or a green “check” symbol. This symbol indicates the status of the automated tests which will
check the correctness of your code. Click on it. On the new page, you should see a table, and under “status”, there should be another symbol. Click on it. The new page will list
the “categories” of tests for this repository. These will be some combination of “A”, “B”, “C”, and “D”. These letters indicate what grade you earned on the assessment for
passing those tests. If you click on one of them, it will detail for you which sub-tests you passed and failed which might help you debug.
It is good practice to always check gitlab after submitting a project or lab in this course.
Task 5. Check to make sure you are passing all the tests on gitlab.
Getting Checked Off
At the end of every lab, you will need to call over a member of course staff to review your work. Sometimes, we will ask you to think about questions that you’ll review with the person who checks you off. For this lab, please answer the single following question:
Task 6.
Click the “Submit OpenEndeds” button below.
Then, call over a member of course staff by typing “!question done” into your workspace text channel. Someone will get to you as soon as possible.